Swiss Federal Statistical Office (FSO) · annual
Regional GDP
791087.2
2008-01-01 – 2022-01-01
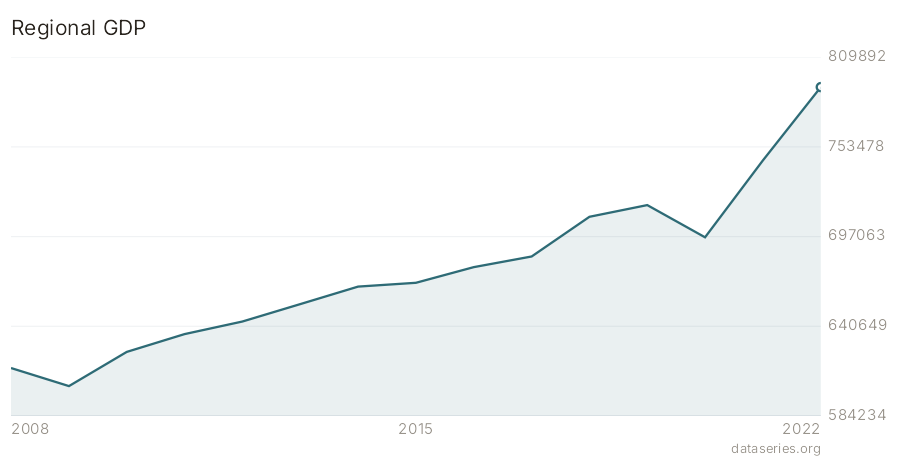
Gross domestic product broken down by canton (all 26) and by the 7 greater regions (NUTS-2), at current prices in CHF million — the regional decomposition of the national GDP that the SNB cubes and the SECO national-accounts series do not carry. Switzerland (the national total) is the root of a single drill-down tree: Switzerland → greater region → canton, so the share of any canton in its region, or of any region in the country, is one division away. Switzerland is among the most economically concentrated small economies, and this dataset makes the Zurich / Lake-Geneva / Northwestern cluster visible at a glance.
Recent values
| Date | Switzerland |
|---|---|
| 2011-01-01 | 635738.7 |
| 2012-01-01 | 643645.6 |
| 2013-01-01 | 654611.7 |
| 2014-01-01 | 665618.4 |
| 2015-01-01 | 668006.4 |
| 2016-01-01 | 677848.3 |
| 2017-01-01 | 684558.5 |
| 2018-01-01 | 709521.6 |
| 2019-01-01 | 716878.6 |
| 2020-01-01 | 696620.0 |
| 2021-01-01 | 745067.0 |
| 2022-01-01 | 791087.2 |