Swiss Federal Statistical Office (FSO) · annual
Hours worked
1200.2
2010-01-01 – 2025-01-01
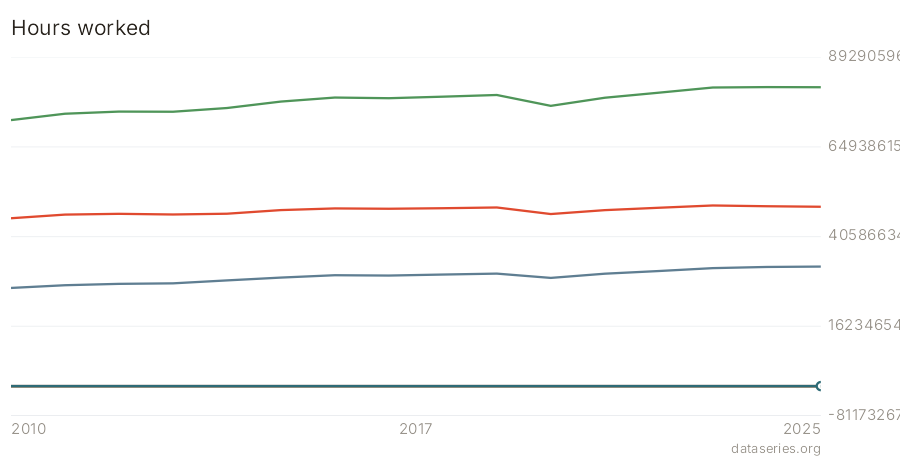
The annual working volume (AVOL) statistic: the total hours actually worked in the Swiss economy, plus its two per-job intensities. One cube carries three measures — the headline usual weekly hours per job (the "Swiss work ~31h/week, not 42" number), the annual hours worked per job, and the absolute annual volume of hours (~8.1 billion hours). All three cut by sex and by working-time category (full-time vs the two part-time bands), so the part-time gender split — Switzerland's defining labour-market feature — reads directly.
Recent values
| Date | Total | Total | Total | Total | Total | Total | Total | Total | Total |
|---|---|---|---|---|---|---|---|---|---|
| 2014-01-01 | 1204.09 | 4679770217.8 | 32.19 | 1702.19 | 7549158251.6 | 26.27 | 1470.91 | 2869388033.8 | 37.36 |
| 2015-01-01 | 1211.67 | 4778406237.7 | 32.09 | 1713.13 | 7724346430.6 | 26.2 | 1479.59 | 2945940192.8 | 37.26 |
| 2016-01-01 | 1212.81 | 4823486997.2 | 31.93 | 1706.48 | 7833706499.5 | 26.15 | 1475.67 | 3010219502.3 | 37.03 |
| 2017-01-01 | 1204.35 | 4814694995.2 | 31.88 | 1682.49 | 7815687127.2 | 26.21 | 1459.94 | 3000992132.0 | 36.84 |
| 2018-01-01 | 1198.84 | 4828969981.5 | 31.79 | 1669.22 | 7857371528.4 | 26.21 | 1449.95 | 3028401546.8 | 36.69 |
| 2019-01-01 | 1192.91 | 4849399312.4 | 31.66 | 1663.29 | 7903188282.3 | 26.1 | 1443.37 | 3053788969.9 | 36.56 |
| 2020-01-01 | 1155.9 | 4671020457.3 | 29.73 | 1611.85 | 7608206740.8 | 24.55 | 1398.84 | 2937186283.5 | 34.27 |
| 2021-01-01 | 1196.53 | 4777079587.4 | 30.69 | 1643.64 | 7828655053.2 | 25.5 | 1434.67 | 3051575465.8 | 35.26 |
| 2022-01-01 | 1210.35 | 4841570883.7 | 31.1 | 1636.71 | 7965498745.2 | 26.13 | 1438.04 | 3123927861.5 | 35.45 |
| 2023-01-01 | 1205.83 | 4903439147.3 | 31.16 | 1620.87 | 8106016657.1 | 26.28 | 1426.84 | 3202577509.8 | 35.46 |
| 2024-01-01 | 1201.9 | 4882891061.2 | 30.94 | 1607.86 | 8117326974.3 | 26.19 | 1417.13 | 3234435913.2 | 35.18 |
| 2025-01-01 | 1200.18 | 4868805738.4 | 30.89 | 1602.18 | 8113580726.5 | 26.2 | 1412.92 | 3244774988.0 | 35.08 |