Swiss Federal Statistical Office (FSO) · quarterly
Industry & construction turnover
117.4
1999-01-01 – 2026-01-01
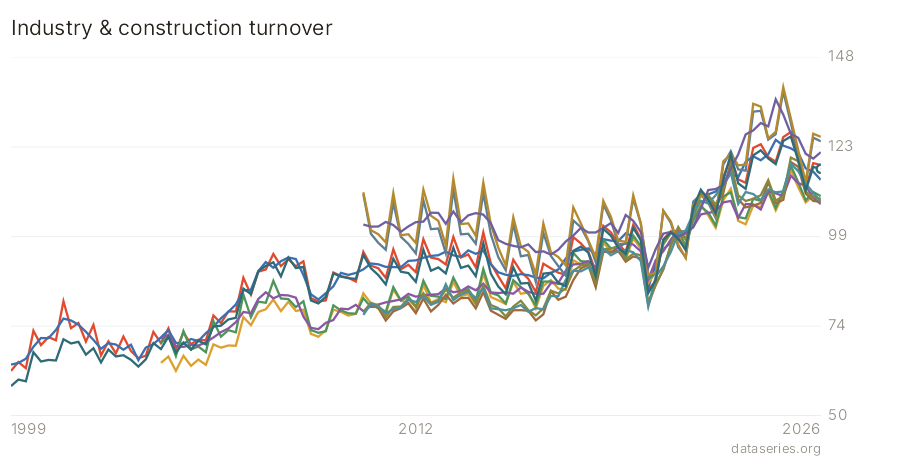
The quarterly turnover / production index for the secondary sector — industry (NOGA sections B–E) and construction (section F) — published as one dataset split by NOGA section. FSO migrated this series off the dead PX-Web STAT-TAB onto its new SDMX 2.1 endpoint (disseminate.stats.swiss, agency CH1.KEU, flow DF_KEU_Q1), so it shares the R/source_fso_sdmx.R reader with ch_fso_retail. We keep the secondary-sector slice: the industry aggregate B-E (and its sections B mining, C manufacturing, D energy), construction F, and the construction divisions 41 (buildings), 42 (civil engineering), 43 (specialised construction), plus their aggregate 41_43.
Recent values
| Date | B-E Industry | B-E Industry | B-E Industry | B-E Industry | B-E Industry | B-E Industry | B-E Industry | B-E Industry | B-E Industry | B-E Industry | B-E Industry | B-E Industry |
|---|---|---|---|---|---|---|---|---|---|---|---|---|
| 2023-04-01 | 113.44 | 114.53 | 115.15 | 103.14 | 104.16 | 103.93 | 109.09 | 117.28 | 110.14 | 118.4 | 107.76 | 121.38 |
| 2023-07-01 | 111.94 | 113.61 | 119.36 | 102.19 | 103.8 | 107.76 | 106.85 | 116.93 | 108.6 | 118.59 | 111.06 | 126.89 |
| 2023-10-01 | 121.14 | 123.17 | 120.86 | 107.33 | 109.2 | 107.67 | 107.33 | 133.14 | 109.2 | 135.31 | 110.5 | 127.98 |
| 2024-01-01 | 122.52 | 124.19 | 119.79 | 106.94 | 108.63 | 106.25 | 108.04 | 133.37 | 110.18 | 134.53 | 108.83 | 130.01 |
| 2024-04-01 | 120.27 | 120.67 | 121.43 | 111.0 | 111.45 | 111.26 | 113.81 | 125.45 | 114.34 | 125.78 | 111.76 | 129.09 |
| 2024-07-01 | 118.72 | 119.4 | 125.4 | 106.02 | 106.67 | 110.68 | 108.03 | 126.95 | 108.7 | 127.63 | 110.98 | 136.53 |
| 2024-10-01 | 125.07 | 126.15 | 123.81 | 110.5 | 111.48 | 109.96 | 108.9 | 138.7 | 109.87 | 139.89 | 111.23 | 132.33 |
| 2025-01-01 | 126.33 | 127.55 | 123.06 | 117.08 | 118.32 | 115.54 | 119.29 | 130.03 | 120.52 | 131.29 | 118.83 | 127.09 |
| 2025-04-01 | 119.66 | 121.05 | 121.85 | 112.38 | 113.76 | 113.51 | 118.0 | 121.31 | 119.53 | 122.62 | 116.79 | 125.95 |
| 2025-07-01 | 111.49 | 112.03 | 117.54 | 108.21 | 108.77 | 112.77 | 110.63 | 113.25 | 111.17 | 113.79 | 113.38 | 121.58 |
| 2025-10-01 | 117.94 | 118.99 | 116.65 | 110.03 | 111.06 | 109.49 | 108.62 | 126.0 | 109.67 | 127.08 | 110.85 | 120.24 |
| 2026-01-01 | 117.43 | 118.49 | 114.4 | 108.93 | 109.92 | 107.74 | 108.33 | 124.99 | 109.22 | 126.23 | 108.37 | 122.0 |