State Secretariat for Economic Affairs (SECO) · weekly
Weekly economic activity (WEA)
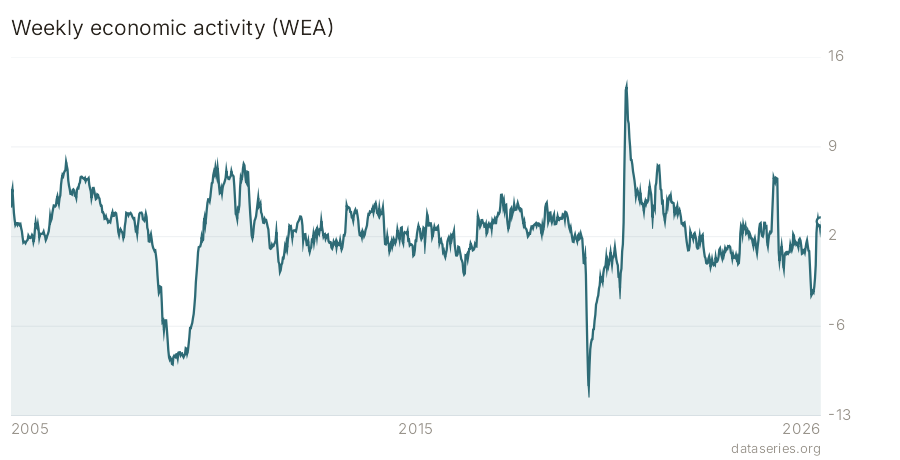
The catalog's first weekly series. SECO's Weekly Economic Activity index (WEA, German WWA) is a high-frequency nowcasting indicator built from a basket of weekly real-economy signals (electricity consumption, payment transactions, freight, foot traffic, etc.). It is scaled to the year-on-year growth rate of real, seasonally / calendar / sport-event adjusted GDP, so a WEA value of 2.0 reads as "activity running about 2% above the same week a year earlier" — it is a level on a growth-rate scale, not something to be differenced again. SECO publishes it in the swissdata long-CSV format, like ch_seco_gdp, but without the _json.txt meta sidecar, so the dimension/label metadata is built by hand in the parser (optionally cross-checked against the companion wwa.xlsx beschriftung sheet, which carries the en/de/fr/it labels). The structure dimension carries two series: the headline seco_wwa index (2005-> , the default) and seco_wwa_pre_covid, a discontinued variant (2019-12 .. 2022-12) that measured weekly activity relative to the Q4 2019 pre-crisis level rather than YoY.
Recent values
| Date | Index of weekly economic activity (WEA) |
|---|---|
| 2026-04-27 | 2.72 |
| 2026-05-04 | 3.29 |
| 2026-05-11 | 3.05 |
| 2026-05-18 | 4.0 |
| 2026-05-25 | 3.74 |
| 2026-06-01 | 3.52 |
| 2026-06-08 | 4.02 |
| 2026-06-15 | 4.57 |
| 2026-06-22 | 3.58 |
| 2026-06-29 | 3.35 |
| 2026-07-06 | 3.34 |
| 2026-07-13 | 2.7 |