Swiss National Bank · quarterly
Employees, by economic activity
4323.4
1991-07-01 – 2026-01-01
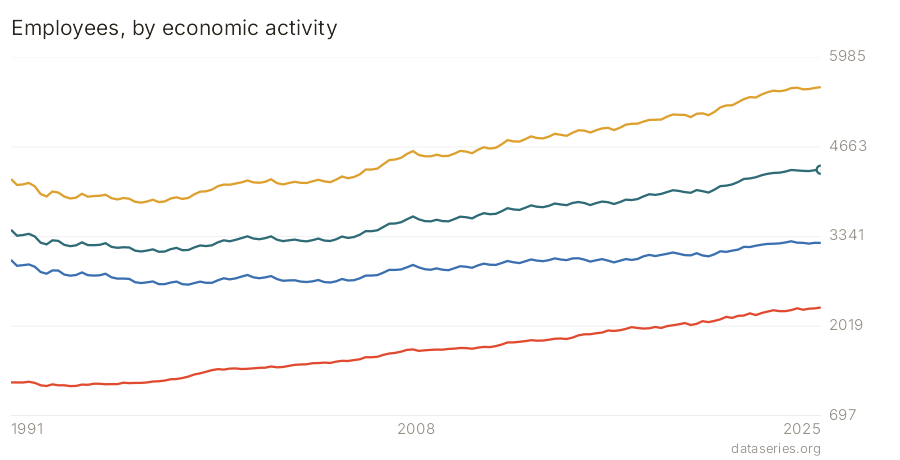
Employees broken down by economic activity (NACE-style sectors) crossed with an employment type. The SNB version overlaps FSO ch_fso_besta (jobs by division); the concept universe flags this and keeps FSO as the intended canonical, so this is the labelled alternate. The distinctive feature is the two-axis cross: four head-count bases (Total, full-time, part-time, full-time-equivalents) times ~14 leaf sectors, which lets you read part-time intensity and FTE conversion by sector, something the FSO jobs cube does not expose the same way. Values are in thousands of persons.
Recent values
| Date | Total | Total | Total | Total |
|---|---|---|---|---|
| 2023-04-01 | 4245.03 | 2214.13 | 3221.39 | 5435.52 |
| 2023-07-01 | 4266.27 | 2235.68 | 3233.05 | 5468.73 |
| 2023-10-01 | 4278.81 | 2255.5 | 3235.73 | 5491.24 |
| 2024-01-01 | 4282.55 | 2242.16 | 3240.62 | 5482.78 |
| 2024-04-01 | 4299.01 | 2242.25 | 3254.01 | 5496.26 |
| 2024-07-01 | 4322.54 | 2257.35 | 3271.64 | 5528.99 |
| 2024-10-01 | 4315.88 | 2284.22 | 3251.23 | 5535.44 |
| 2025-01-01 | 4309.59 | 2262.82 | 3248.47 | 5511.28 |
| 2025-04-01 | 4306.5 | 2278.24 | 3237.23 | 5515.48 |
| 2025-07-01 | 4319.52 | 2282.51 | 3249.3 | 5531.82 |
| 2025-10-01 | 4326.7 | 2296.36 | 3247.74 | 5544.11 |
| 2026-01-01 | 4323.44 | 2300.69 | 3236.66 | 5537.35 |