Swiss National Bank · monthly
Foreign trade by goods category
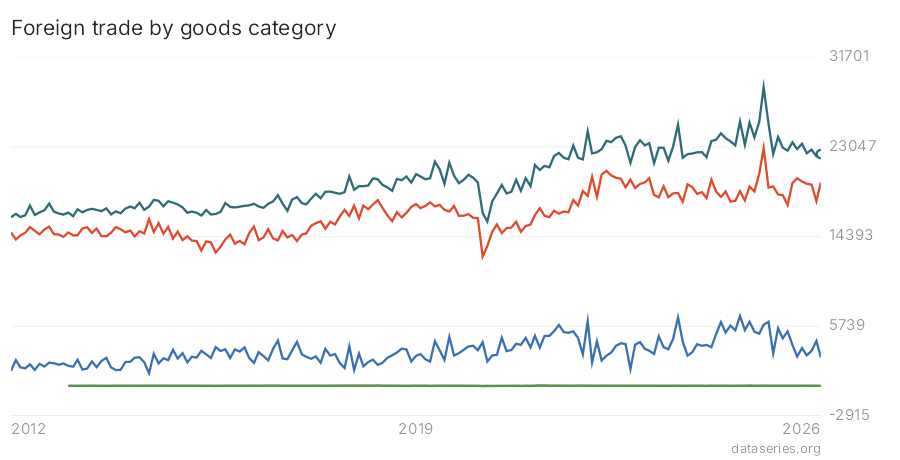
Switzerland's monthly foreign trade split by goods category, the canonical trade series in the catalog. It is a three-way cube: trade flow (exports / imports / balance) times a deep goods hierarchy times a value-or-change axis. The goods axis goes two levels deep (e.g. group CHEM -> C21 pharma preparations, C20 chemicals), which surfaces the pharma and watches drivers that dominate Swiss exports (C21, C2652). The quirky axis is D2 "Value/Change": the source nests a level (WMF value in CHF millions) with two year-on-year %-change leaves (N nominal, R real) under one dimension. The nominal change N is exactly the YoY % of WMF, so it is dropped as redundant with the app's YoY toggle; the real change R (price-deflated, not recomputable from the value) is kept. That leaves D2 = {WMF nominal value, R real change} — two genuinely different series, so the value column still means CHF millions for WMF and a percent change for R. Despite a 2012 catalog start, the CHF-million level rows begin 2012 while the %-change rows begin 2013 (a year of base needed first).
Recent values
| Date | Total | Total | Total | Total | Total |
|---|---|---|---|---|---|
| 2025-06-01 | 23921.7 | 18466.36 | 5455.34 | -2.5 | 1.7 |
| 2025-07-01 | 22949.49 | 18408.04 | 4541.45 | -0.4 | 3.6 |
| 2025-08-01 | 22642.21 | 17454.83 | 5187.38 | -1.8 | 2.9 |
| 2025-09-01 | 23529.14 | 19576.45 | 3952.69 | -3.2 | 2.4 |
| 2025-10-01 | 22860.65 | 20022.12 | 2838.53 | -13.2 | 1.2 |
| 2025-11-01 | 23331.11 | 19711.06 | 3620.06 | -13.1 | 6.2 |
| 2025-12-01 | 22563.08 | 19519.12 | 3043.96 | -20.1 | 1.6 |
| 2026-01-01 | 22853.83 | 19496.47 | 3357.36 | 2.4 | 6.4 |
| 2026-02-01 | 22172.03 | 17831.56 | 4340.47 | -3.2 | -2.5 |
| 2026-03-01 | 22527.4 | 19705.23 | 2822.16 | -10.6 | -4.5 |
| 2026-04-01 | 22416.37 | 19133.68 | 3282.69 | -6.5 | 8.1 |
| 2026-05-01 | 25423.02 | 19785.09 | 5637.93 | 4.3 | 7.5 |