Swiss National Bank · quarterly
Business cycle signals
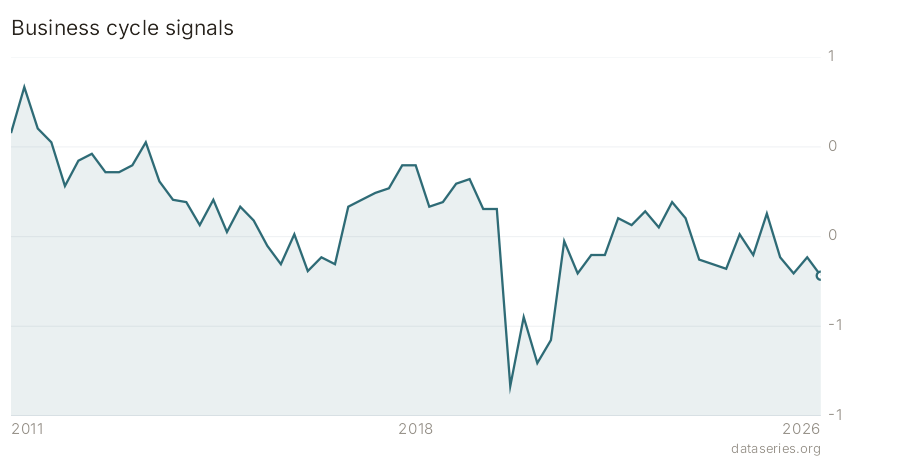
This is the SNB's own read of the business cycle, distilled from its quarterly talks with companies across Switzerland (the SNB regional network / company survey). Unlike a single composite barometer, it ships 24 separate qualitative signals on one flat dimension: turnover vs the year-back quarter and vs the previous quarter, capacity utilisation, procurement difficulties, margins, lending conditions, liquidity, staff shortages, expected turnover and employment, expected purchase- and sales-price changes, planned equipment and construction investment, and quantitative wage- and inflation-expectation series. Most signals are diffusion-style indices; a handful (LELJ, LEFJ wage increases, IERW inflation expectations) are in percent. The one nested item is IERW -> {IERWM, IERWJ} (inflation expected in 6-12 months vs 3-5 years). Shorter history than the price/money cubes (starts 2011), and it is the only catalog series that captures firm-level sentiment direct from the central bank rather than a survey institute. KOF's barometer is the canonical leading indicator; this sits beside it as the SNB's qualitative companion.
Recent values
| Date | Capacity utilisation (Index) |
|---|---|
| 2023-07-01 | -0.15 |
| 2023-10-01 | -0.33 |
| 2024-01-01 | -0.35 |
| 2024-04-01 | -0.37 |
| 2024-07-01 | -0.22 |
| 2024-10-01 | -0.31 |
| 2025-01-01 | -0.13 |
| 2025-04-01 | -0.32 |
| 2025-07-01 | -0.39 |
| 2025-10-01 | -0.32 |
| 2026-01-01 | -0.4 |
| 2026-04-01 | -0.32 |