Bundesamt für Statistik (BFS) · jährlich
Schweiz: Arbeitsstunden
30.9
2010-01-01 – 2025-01-01
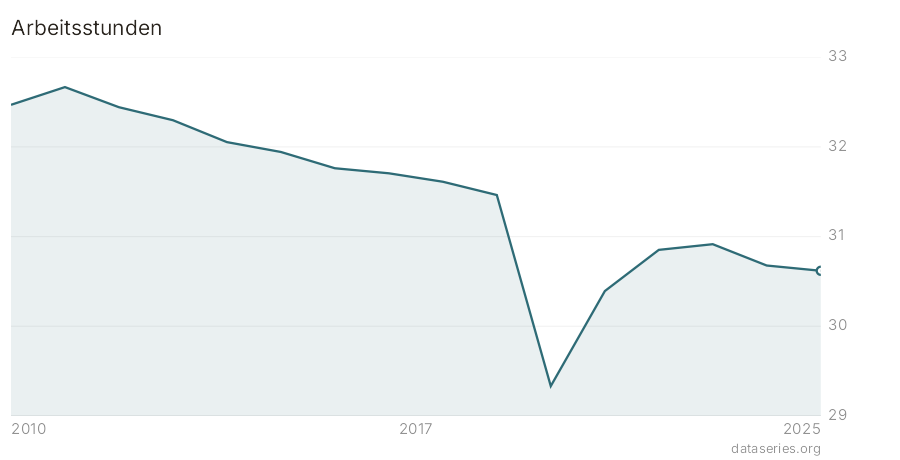
Wie viele Stunden in der Schweiz tatsächlich gearbeitet wird: Gesamtvolumen, Stunden pro Stelle und übliche Wochenstunden, nach Geschlecht sowie Voll- und Teilzeit.
NA
- Geschlecht
sex - Total
_T - Arbeitszeit
worktime - Total
_T - Messgrösse
measure - Normalarbeitszeit pro Woche und Stelle
weekly
dims=sex=_T;worktime=_T;measure=weekly
Aktuelle Werte
| Datum | Total |
|---|---|
| 2014-01-01 | 32.19 |
| 2015-01-01 | 32.09 |
| 2016-01-01 | 31.93 |
| 2017-01-01 | 31.88 |
| 2018-01-01 | 31.79 |
| 2019-01-01 | 31.66 |
| 2020-01-01 | 29.73 |
| 2021-01-01 | 30.69 |
| 2022-01-01 | 31.1 |
| 2023-01-01 | 31.16 |
| 2024-01-01 | 30.94 |
| 2025-01-01 | 30.89 |
Verwandte Datensätze
- Offene Stellen Bundesamt für Statistik (BFS)
- Beschäftigte nach Wirtschaftsabteilung Bundesamt für Statistik (BFS)
- Registrierte Arbeitslosigkeit Schweizerische Nationalbank (SNB)
- Schweizerischer Lohnindex Bundesamt für Statistik (BFS)
- Erwerbstätige (ETS) Bundesamt für Statistik (BFS)
- Beschäftigte nach Wirtschaftszweig Schweizerische Nationalbank (SNB)
- Investitionen (Bruttoanlageinvestitionen) im Detail Bundesamt für Statistik (BFS)
- Neuzulassungen von Personenwagen nach Kanton und Treibstoff Bundesamt für Statistik (BFS)